)
Background
Data centres are widely known to be energy-intensive and were estimated to form around 1% of global electricity consumption in 2018. The first step in reducing the environmental impact of data centres and cloud deployments is to measure it – and increasingly, cloud users want to understand their individual impact. Providing this information to users can motivate them to reduce inefficient usage – for example, by avoiding unnecessary computations.
Public cloud providers are beginning to provide more data to users about their environmental impact, with Microsoft Azure, Google Cloud and Amazon Web Services releasing tools to show users the carbon footprint of their workloads. As operators of OpenStack cloud deployments, can we make the same service available to our users?
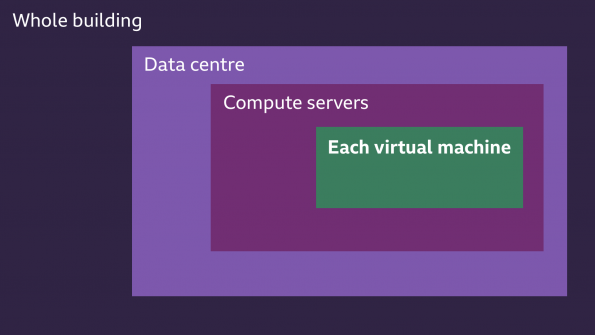
At BBC Research & Development, we have built and deployed two OpenStack cloud environments based in on-premise data centres, which staff in the department can use for research purposes. Virtual machines (VMs) can host web servers, process media or be used for machine learning.
Scope and the accepted approach for reporting emissions
We decided to focus on understanding the carbon dioxide emissions related to the electricity usage of data centres (scope 2 emissions) and investigate whether we could report the emissions each VM is directly responsible for to users. A VM’s emissions should be representative of its workload so that if users try to reduce their environmental impact by making changes to their workloads, this is reflected in the data. A full lifecycle assessment of a data centre would also consider factors such as material usage and emissions released during hardware manufacture, classified as scope 3 emissions. However, due to limited data from manufacturers, this is often difficult to report accurately. We wanted to give users agency over their individual usage and focus on factors they could realistically change, so we deemed it out of scope for this study.
The accepted approach for measuring and reporting a data centre’s greenhouse gas (GHG) emissions is to follow methodologies such as the GHG Protocol’s ICT Sector Guidance. The GHG Protocol is beneficial for reporting as it accounts for all GHG emissions by allocating all of the emissions/power consumption of the data centre or server to the VMs. However, their approach incorporates factors that are out of the control of users. For example, if a user’s VM is the only one on a server, they will be allocated more emissions than if it had been running the same workload on a server with ten other VMs. Using open-source tools, we designed our own bottom-up approach to measure the GHG emissions of a VM based on its CPU usage, which is directly linked with its workload. This approach was designed to aim for accuracy instead of completeness by providing users with data reflecting the factors they could try to reduce.
Tools
While researching tools to monitor VM power usage, we evaluated Scaphandre – an open-source monitoring agent for energy consumption metrics created by Hubblo and Benoit Petit. Scaphandre can measure the CPU power consumption of the whole server and its processes using Intel RAPL alongside CPU utilisation statistics stored in proc/stat. Scaphandre estimates how many CPU watts each process is responsible for by looking at the CPU time spent on it, and the CPU power consumption for the whole server reported by Intel RAPL. Each running VM appears as a process running on the server – therefore, Scaphandre can report the CPU power consumption for each VM.
We then used the Carbon Intensity API, created by the UK National Grid ESO, to calculate the carbon dioxide emissions corresponding to each VM’s CPU power consumption. This API provides the number of grams of carbon dioxide (gCO2) emitted to generate a kilowatt-hour (kWh) of electricity consumed at a UK regional level. This figure, referred to as the carbon intensity of electricity generation, varies over time according to the type of generation and electricity demand. Multiplying the carbon intensity figure by the CPU power consumption of a VM at a given point in time results in the carbon dioxide emissions the VM is responsible for.
Implementation
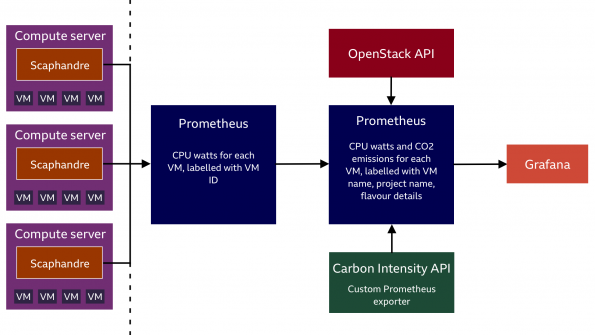
We used Ansible to deploy the Scaphandre package to all compute hosts and ran Scaphandre’s Prometheus exporter. This time series data provides the power consumption of the server’s CPU and the CPU power consumption of each process.
In the time series data, the CPU power consumption of VM processes is labelled with the VM UUID. We enriched this data using the OpenStack API to add labels for the VM name, project name and flavour details, creating a new Prometheus exporter. Finally, the carbon emissions per VM are calculated by multiplying the power consumption data by the Carbon Intensity data. We now have a dataset that has appropriate metrics and labelling to allow reporting queries to be performed.
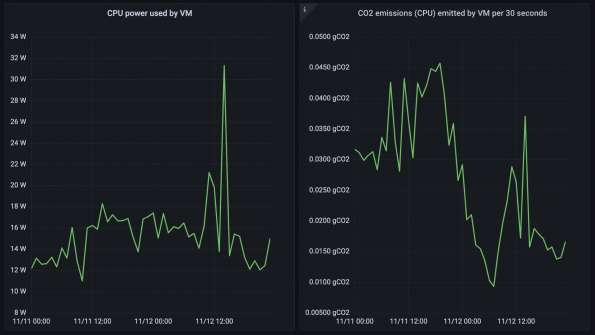
We then visualised this data using Grafana dashboards, accessible to users of our cloud deployment. These visualisations included graphs of CPU power usage and carbon dioxide emissions for each VM over time, as shown in the figure below. It is clear that carbon dioxide emissions are not directly proportional to power usage; this is because the carbon intensity of the UK power grid varies significantly according to the time of day.
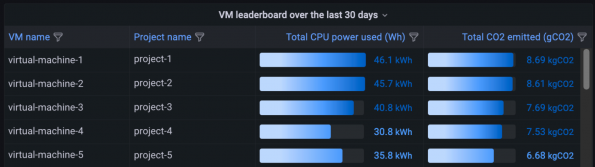
We created leaderboards to allow users to compare their VMs to others doing similar tasks but achieving significantly lower emissions. For example, one team discovered high carbon emissions from a test Kubernetes cluster hosting a simple web service. The energy overhead of running the Kubernetes cluster was far greater than that of the application itself and seeing this data prompted them to decommission the test cluster.
What’s next
In some cases, users may not understand what is driving the CPU power consumption of their VM. If a VM is running multiple tasks, identifying inefficiencies becomes harder – why was the Kubernetes cluster hosting a web service using so much energy? This could be solved by showing users the power consumption of processes happening inside their VM. Scaphandre already makes this possible using virtiofs to share Intel RAPL’s CPU power consumption metrics with each VM on the server, allowing users to run Scaphandre inside their VM and obtain per-process CPU power consumption. We could not test this as virtiofs requires libvirt version 6.2.0, which is not currently supported on our Ubuntu Focal deployment. A new feature in Nova to provide automatic virtiofs mounts from the host would be valuable in this situation.
In addition, we would like to measure efficiency alongside consumption, for example, by comparing a VM’s CPU time with its allocated resources. This would encourage users not to over-provision their VMs, and an efficiency metric may provide better comparisons in our leaderboards instead of focusing on the largest power users. Efficient use of resources also maximises hardware utilisation, making the best use of our investment in infrastructure.
Another next step is to recommend our users improve their usage efficiency. For example, a recommendation could be to schedule batch workloads when carbon intensity is lower (the Carbon Intensity API provides a 96-hour forecast to facilitate this).
CPU power consumption does not fully represent a VM’s energy use. The data we provide to users does not include server overheads, PSU, disks, GPU usage, memory, storage, networking or other supporting services. Some of these factors could be accounted for using the difference between the PDU/IPMI measurements and Scaphandre’s server measurements. Intel RAPL and Scaphandre also provide measurements for a server’s DRAM power consumption, which could account for memory usage, but should be allocated fairly to VMs. Whilst CPU and GPU power usage is more directly linked to user workload, it is unclear if this is true for storage and networking energy, which are thought to be more strongly related to installed capacity. Cooling and UPS in the broader data centre infrastructure have also not been included and could be reported as a separate metric. The energy consumption of all these components is part of a VM’s environmental impact and should be investigated and measured as accurately as possible.
Beyond energy usage, the embodied emissions (scope 3) related to hardware manufacture should be reported to users as a separate metric in the reporting system. More organisations are researching this area and are creating tools that will provide more accurate data to facilitate this.
Conclusion
Providing data about the environmental impact of VMs to users of an OpenStack cloud deployment is clearly achievable with tools like Scaphandre. The data is both informative and can be used to motivate more responsible and efficient usage. There is no standardised methodology for reporting VM power or emissions, with each public cloud provider using its own approach. While more work, standardisation, and research is needed in this area to extend the data further than CPU power consumption, the early signs are promising.
Many thanks to Benoit Petit and Hubblo for creating Scaphandre and assisting us, the National Grid ESO and their collaborators for creating the Carbon Intensity API, and the reviewers of this article, including the Computing and Networks at Scale and Sustainable Engineering teams at BBC R&D.
- Environmental Reporting Dashboards for OpenStack from BBC R&D - February 9, 2022