)
This post originally ran on the Blog of the ZHAW Zurich University of Applied Sciences. Oleksii Serhiienko is a researcher at the ICCLab at Cloud Monitoring with a focus on OpenStack projects and python development.
Introduction
The Ceilometer project is a core OpenStack service that provide collection of metering data on managed virtual resources (e.g. compute, storage, networking). Before it was only possible to collect data from OpenStack virtual resources which are running upon an OpenStack deployment. The work presented hereafter addresses this issue outlines a means to monitor both virtual and physical resources in an integrated common approach. This work has been appeared in the upcoming OpenStack release named “Icehouse”.
The Problem
From small to large deployments of OpenStack, monitoring tools are very important. OpenStack environments can include a lot of physical nodes, for example CERN has in the region of 6000 physical nodes. To manage them and be sure that everything is operating correctly, these nodes should be monitored (hardware and software) such that they can be managed. By monitoring, the operator of OpenStack deployments can get notifications of current or potential issues. By tackling these problems the operator can ensure smooth operations and maintenance of existing customer SLAs.
A large number of commercial and non-commercial monitoring tools exist, such as Nagios, Zabbix, and the likes. However, none of them was natively developed for OpenStack. It is better that the monitoring tools are part of the main OpenStack components. By not having the operator search, install, configure and integrate separately monitoring software, provides further operational efficiencies These efficiencies include reduced costs and simplification (i.e. an operator has one common management stack). As it currently is, OpenStack Ceilometer does not support both virtual and physical resource monitoring therefore it is impossible to collect monitoring data from different physical hosts in OpenStack deployment. Also OpenStack needed monitor cpu, memory, disk, network statistics not only from current host but from all of the physical hosts and machines .
Architecture Approach
Ceilometer’s architectural model was extended to support the concept of “resource”. A resource is any physical node or device that is present in an OpenStack deployment. The main goal of this work was to monitor resources in an OpenStack deployment upon which the OpenStack services are running (Nova, Cinder, Glance etc.) or network devices running or managed by the OpenStack Neutron service.
The process of resource monitoring and data collection is such, that metrics defined for a resource are extracted by a Hardware Agent. All these collected metrics are stored in the Ceilometer Storage DB.
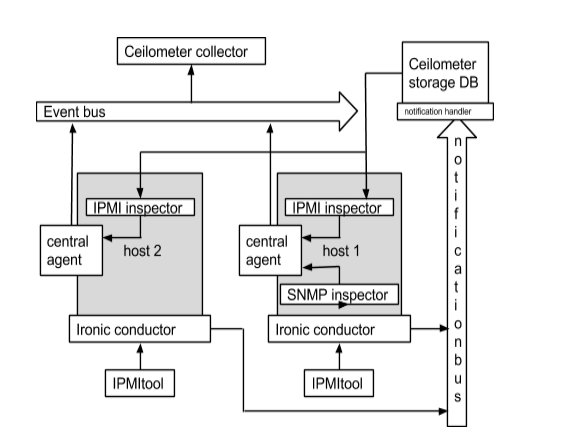
To collect monitoring data of physical resources, respective device monitoring protocol implementations are required, most importantly SNMP, IPMI, or SMART. In the architecture of Ceilometer these protocols are implemented in so-called Inspectors which are a novel architectural feature of Ceilometer, see the Figure above. Given the existence of Inspectors, so-called Hardware Agents are able poll this data through the Inspectors on different resources. This allows the collection of data from any resource, such as routers and switches. The approach developed supports the definition of any data and data model, and from what resource this data must be collect by Ceilometer. The Hardware Agent polls and publishes all collected data onto the Event Bus. After that other systems like billing and rating systems can read this data through the Ceilometer API.
In the Ceilometer project a Central Agent software component already exists, which has a few similar features, as those required by the Hardware Agent. However, the Central Agent is only able to monitor running virtual machines and some meters from the OpenStack core. That’s why the Hardware Agent has been contributed as an extension to the Ceilometer Central Agent codebase.
One agent is running on each machine, and gets meters from machine Inspectors based on each Inspectors configuration. Inspectors create meters from resources and sends them to the central agent. This transforms meters to samples which are finally sent to Ceilometer collector. The Collector monitors the message queues for notifications and for metering data, either by data push or polling.
SNMP Inspector
The SNMP Inspector monitors devices such as routers, switches etc. The basis for this is the Net-SNMP (snmpd) package. The SNMP Inspector supports such meters as:
- hardware.cpu – cpu stats, average value for CPU load (1, 5, 15 min)
- hardware.memory – memory stats, total and used
- hardware.disk – disk stats, list of all disks with total and used size for each
- hardware.network – network stats, list of IP’s with bandwidth, incoming, outgoing bytes and outgoing errors
The snmpd (a Linux Daemon) running on resources sends data to the SNMP Inspector directly, unlike the IPMI Inspector described below.
IPMI Inspector
The IPMI Inspector monitors resource health data including:
- current.value – current value of fan speed, voltage, temperature
- max.value – maximum available value of stats
- min.value – minimum available value of stats
- current.status – status fan, voltage, temperature (ok/fail)
Originally this IPMI code was part of the Ceilometer codebase, however it was moved over to the Ironic code base as it was found to be more appropriate there.
To collect IPMI data OpenStack deployments require the Ironic Conductor. It will push IPMI monitoring data to Ceilometer on the notification bus. This data is not in the format that Ceilometer requires. The Ceilometer notification handler intercepts this data and stores it in the Ceilometer Storage DB. The Ceilometer IPMI Inspector periodically checks the Ceilometer Storage DB and converts the format from the Ironic message format to the Ceilometer format.
Related Work
There are many third party monitoring tools and frameworks for monitoring physical and virtual resources provided and operated upon by cloud management frameworks. These third party tools include Nagios , Munin and Zabbix . Open source CMFs that, to date, do not have integrated include all the major CMFs of CloudStack, OpenNebula and OpenStack.
Conclusions and Further Work
In order to extend Ceilometer to support monitoring of physical devices it was necessary to extend the architectural model the the concept of “resources.” The central agent has been extended to provide monitoring physical devices. This contribution will soon be used in key European Union funded projects such as XiFi and Mobile Cloud Networking as well as other projects that leverage OpenStack. Future plans of this work include the inclusion of new resource Inspectors such as a SMART Inspector. This work is one more step to make the OpenStack Ceilometer monitoring system better, which is really important considering the size of project and growth rate of deployments. This work was described in an OpenStack blueprint, “Monitoring physical devices” , and will be delivered in the Ceilometer project and will take part in upcoming “Icehouse” release.
Image credit: Michal Janček
- Ceilometer: Full-stack Monitoring for OpenStack - July 11, 2014