)
Auto-scaling is a must ability when it comes to the functionality of a cloud. OpenStack already provides multiple methods to auto-scale virtual machines with Heat, Telemetry stack. However, Telemetry the main stack, which involves in the evaluation process whether an auto-scale is needed, either lacks the contribution or malfunctions. In this article, we will introduce a new tool Faythe, an open-sourced software that we built ourselves, works as a bridge between the cloud platform (OpenStack) and monitoring system (Prometheus), to solve the auto-scale problem in Viettel, which is the largest telco in Vietnam.
Auto-scaling with the traditional approach with Heat & Telemetry
The fundamental idea
Auto-scaling is the combination of three steps:
- Metering
- Alarming
- Scaling
Metering service collects data about service/instance/host load. Alarm service evaluates the data to find out whether you need to add scale-out/scale-in, which triggers the scale-out/scale-in action on Scaling service. The idea is quite simple.
Auto-scaling with the traditional approach with Heat & Telemetry
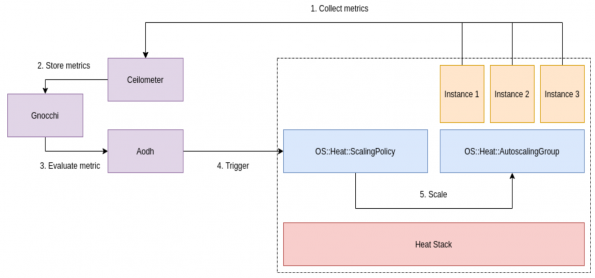
This approach consists of two main components which are packaged and distributed together with OpenStack infrastructure.
- Orchestration: The core component providing auto-scaling is Orchestration (heat). Use Orchestration to define rules using human-readable YAML templates. These rules are applied to evaluate system load based on Telemetry data to find out whether you need to add more instances into the stack. When the load drops, Orchestration can automatically remove the unused instances again.
- Telemetry: Telemetry does OpenStack environment performance monitoring, collecting data on CPU, storage, and memory utilization for instances and physical hosts. Telemetry also involves three smaller services:
- Ceilometer – Monitoring Service: a data collection service that provides the ability to normalize and transform data across all OpenStack core components.
- Gnocchi – Storage Service: provides a time-series resource indexing, metrics storage.
- Aodh – Alarming Service: triggers actions based on defined rules against sample or event data collected by Ceilometer and stored in Gnocchi.
The Telemetry issues
- Telemetry projects (in the Rocky release, at the time we took a survey) have both lack of contribution from the opensource community, which is one of the factors defining open-sourced project longevity.
- As of the Queens release, the Telemetry project had lost most developers. Development on Aodh and Panko stopped.
- Gnocchi was moved out of OpenStack in June 2017. Gnocchi is unmaintained.
- The three projects are dependent on each other, however, which are developed separately. Leading to a small change in one project can make the whole system collapses. Moreover, since Gnocchi is no longer a part of OpenStack, unsynchronized development issues between these are unavoidable.
- In our experiences, RabbitMQ was under heavy load due to Ceilometer workload. If Ceilometer gets stuck, its queues overflow.
- Telemetry only collects information about virtual machines operating systems and OpenStack physical hosts. It is impossible for Telemetry to monitor services and applications running on virtual machines. Additionally, changing and implementing more features for Telemetry are not simple tasks. That includes writing codes, compiling codes, packaging, testing, and deploying to real system.
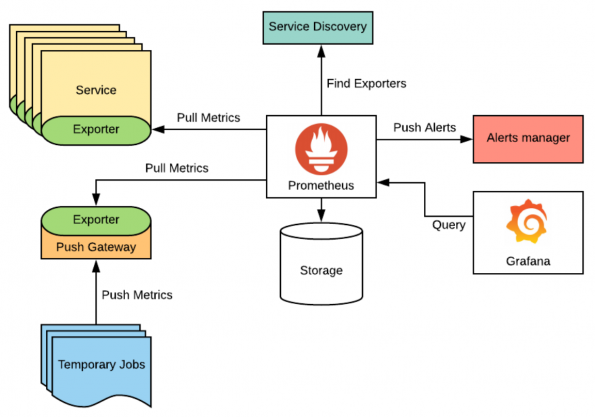
- Telemetry doesn’t fit our ecosystem. We chose Prometheus to monitor the whole infrastructure system as well as applications. Switching/Setup other systems like Telemetry alongside Prometheus is not ideal.
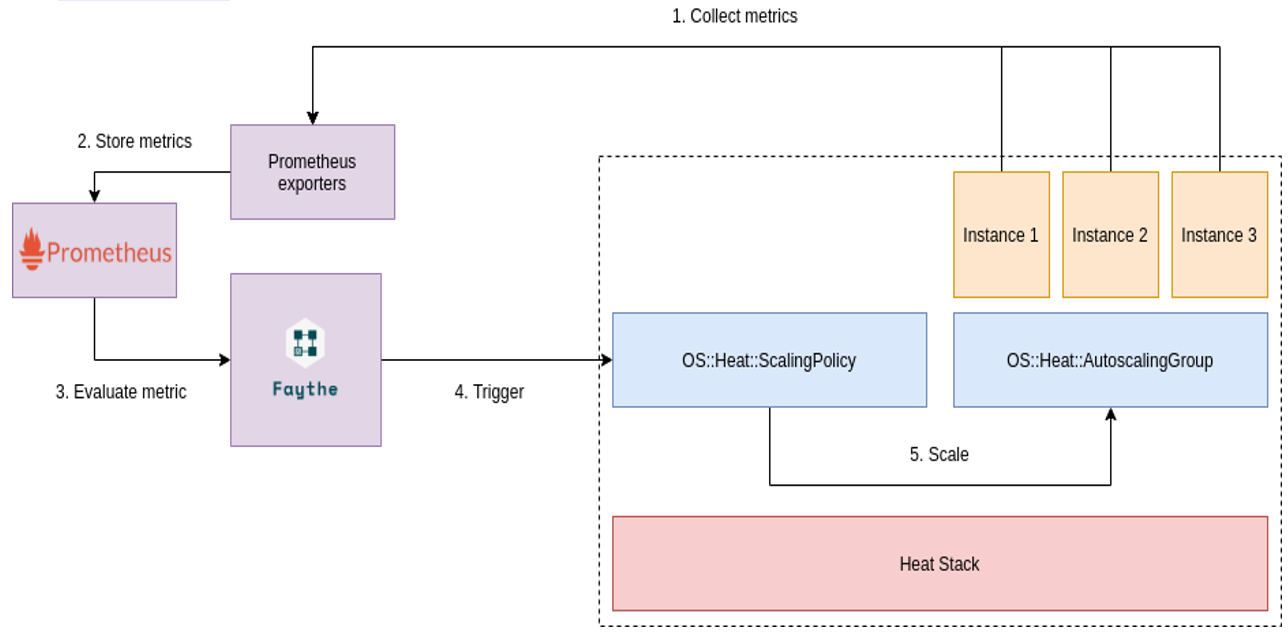
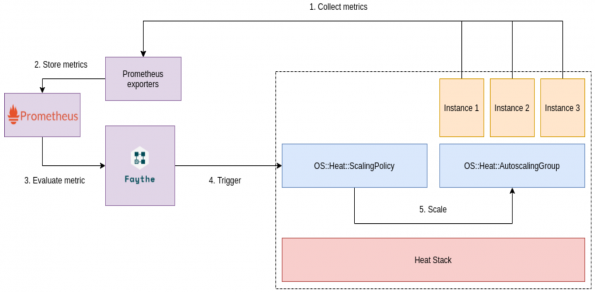
Auto-scaling with Faythe and Prometheus
How it works
Actually, this is not a completely new approach, it leverages Orchestration to do scaling action with new Alarming Service – Faythe and Monitoring Service – Prometheus. As mentioned before, auto-scaling is the combination of three steps: Metering, Monitoring, and Scaling. OpenStack Orchestration is already providing superb scaling service, Heat. Instead of using OpenStack Telemetry for Metering and Alarming, the new approach introduces Faythe, an open-sourced software that we built ourselves, working as a bridge between Cloud platform (OpenStack) to the Monitoring system (Prometheus), and Prometheus.
Why Faythe?
Faythe is one of our proudly created projects, which is designed, developed and implemented while we are working at Viettlet Network. Faythe emerges to fill in the gap between Prometheus and OpenStack.
- Faythe supports Prometheus to collect metrics and PromQL to evaluate and decide whether it is necessary for an alarm.
- PromQL is a very nice query language.
- A wide range of exporters: this is the most valuable point of Prometheus. The open-source community is creating more and more new exporters, which means there are fresh metrics that can be collected by Prometheus.
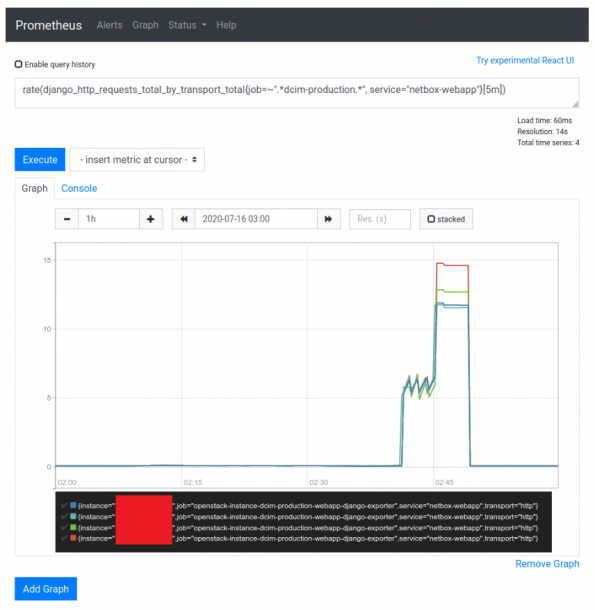
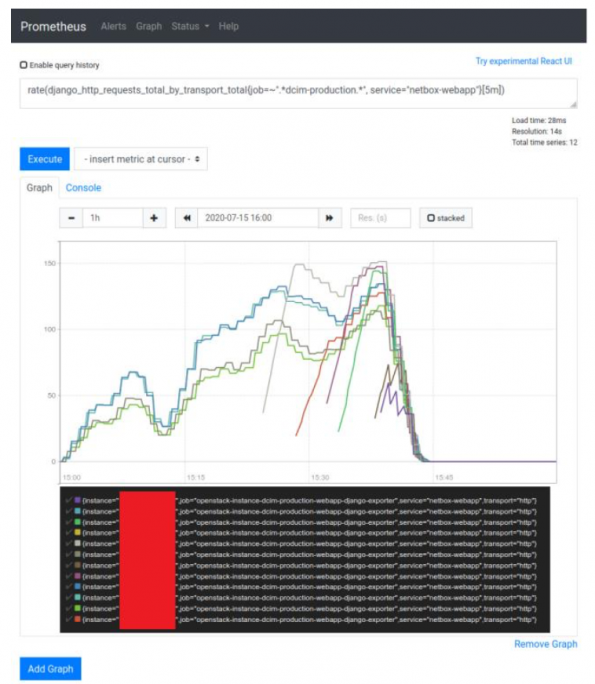
- Flexible: besides the system factor like CPU or Memory usage, users can evaluate any metrics that can be collected by any of the exporters, for example, JVM metrics, HTTP requests related metrics. For example, you can define a scaling rule depend on the number of Django HTTP requests.
- Faythe can be easily configured.
- Faythe has its own cluster mechanism.
Faythe provides not only a user-friendly UI but also complete APIs.
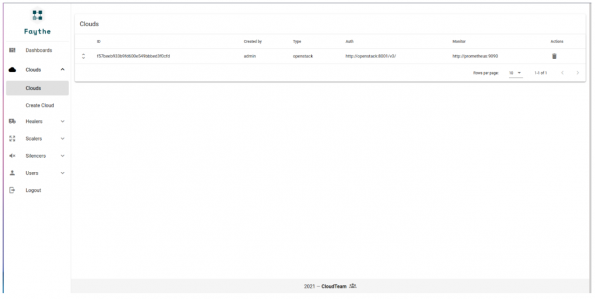
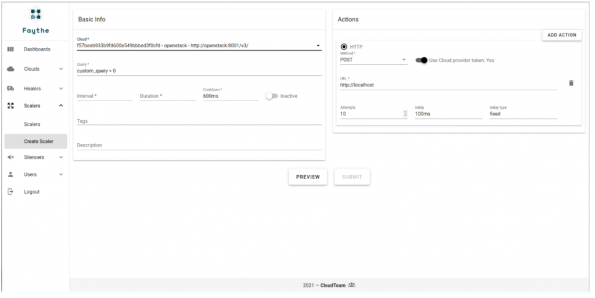
For more details, you can take a look at Faythe repository.
- Containerize
- Observability
- Auto-scaling in Viettel Networks Without OpenStack Telemetry - January 25, 2021