This post originally appeared on Virtual Andy. Andy is a Systems Engineer with the Rackspace Cloud working from home in Lexington, KY. Formerly a VMware Systems Administrator (VCP 4) for Murray State University in Murray, KY. You should follow him on Twitter.
At the OpenStack Operators meetup the question was asked about monitoring issues that are related to RabbitMQ. Lots of OpenStack components use a message broker and the most commonly used one among operators is RabbitMQ. For this post I’m going to concentrate on Nova and a couple of scenarios I’ve seen in production.

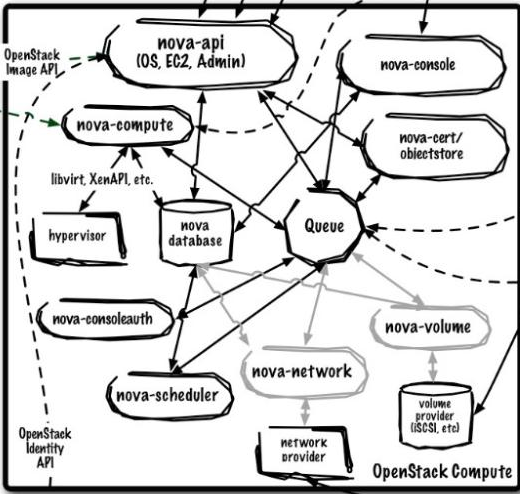
It’s important to understand the flow of messages amongst the various components and break things down into a couple of categories:
- Services which publish messages to queues (arrow pointing toward the queue in the diagram)
- Services which consume messages from queues (arrow pointing out from the queue in the diagram)
It’s also good to understand what actually happens when a message is consumed. In most cases, the consumer of the queue is writing to a database.
An example would be for an instance reboot, the nova-api publishes a message to a compute node’s queue. The compute service running polls for messages, receives the reboot, sends the reboot to the virtualization layer, and updates the instance’s state to rebooting.
There are a couple of scenarios queue related issues manifest:
-
Everything’s broken – easy enough, rebuild or repair the RabbitMQ server. This post does not focus on this scenario because there is a considerable amount of material around hardening RabbitMQ in the OpenStack documentation.
-
Everything is slow and getting slower – this often points to a queue being published to at a greater rate than it can be consumed. This scenario is more nuanced, and requires an operator to know a couple of things: what queues are shared among many services and what are publish/consume rates during normal operations.
- Some things are slow/not happening – some instance reboot requests go through, some do not. Generally speaking these operations are ‘last mile’ operations that involve a change on the instance itself. This scenario is generally restricted to a single compute node, or possibly a cabinet of compute nodes.
Baselines are very valuble to have in scenarios 2 and 3 to compare normal operations to in terms of RabbitMQ queue size/consumption rate. Without a baseline, it’s difficult to know if the behavior is out of normal operating conditions.
There are a couple of tools that can help you out:
- Diamond RabbitMQ collector (code, docs)- Send useful metrics from RabbitMQ to graphite, requires the RabbitMQ management plugin
- RabbitMQ HTTP API – This enables operators to retrieve specific queue statistics instead of a view into an entire RabbitMQ server.
- Nagios Rabbit Compute Queues – This is a script used with Nagios to check specified compute queues which helps determine if operations to a specific compute may get stuck. This helps what I referred to earlier as scenario 3. Usually a bounce of the nova-compute service helps these. The script looks for a local config file which would allow access to the RabbitMQ management plugin. Example config file is in the gist.
- For very real time/granular insight, run the following command on the RabbitMQ server:
— watch -n 0.5 ‘rabbitmqctl -p nova list_queues | sort -rnk2 |head’
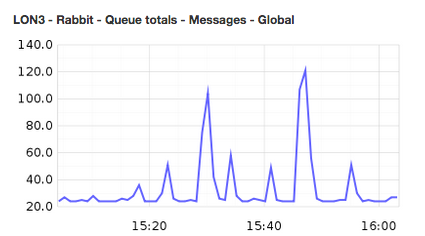
Here is an example chart that can be produced with the RabbitMQ diamond collector which can be integrated into an operations dashboard:

Baseline monitoring of the RabbitMQ servers themselves isn’t enough. I recommend an approach that combines the following:
- Using the RabbitMQ management plugin (required)
- Nagios checks on specific queues (optional)
- Diamond RabbitMQ collector to send data to Graphite
- Dashboard combining RabbitMQ installations statistics
- Operating OpenStack: Monitoring RabbitMQ - September 4, 2014

)


