)
OpenStack’s User Survey offers the most often-cited insights into how our community uses their clouds, revealing technology choices, project adoption and cloud size. After eight surveys and 14 software releases, OpenStack’s user satisfaction and deep adoption continue to rise.
But what will surprise—and delight—Stackers from every background is the opportunity to ask their own questions and gain insights using a live survey analysis tool. The online dashboard offers six global filter categories and two data sets—aggregate 2016 results and survey answers from the second half 2015.
In addition to the user-driven analysis tool, the User Committee, OpenStack Foundation, and an independent data scientist collaborated on a light version of the User Survey report: a 12-page PDF, Deployments-only Highlights summary covering the charts most often used by the community.
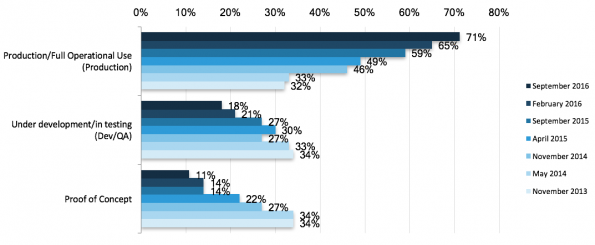
Key findings include the fact that the proportion of deployments in production is 20 percent greater than one year ago, demonstrating how OpenStack clouds are increasingly moving from proof of concept or test phase into full operational use.
OpenStack delivers key competitive advantages to users: according to the survey, 72 percent of users say cost is the number one business driver for adopting OpenStack. Operational efficiency and innovation rounded out the top three answers.
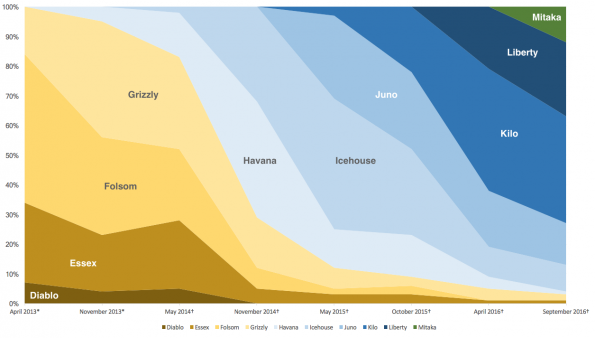
One of the most colorful visualizations in the User Survey reveals how rapidly deployments in production adopt each release. Clouds move to newer versions more rapidly with each release cycle.
To access all of the user survey report’s key findings, visit openstack.org/user-survey. To draw your own conclusions, test the survey analysis dashboard. The full User Survey that includes in-depth comment analysis and more than 50 questions and charts will return in the next survey cycle in advance of the Boston Summit in May 2017.
- OpenStack Days Melbourne: a tipping point in cloud technology - June 5, 2017
- OpenStack Summit veterans share their best tips for newbies - May 1, 2017
- OpenStack User Survey shows wider adoption, larger clouds - April 24, 2017