)
(a) Introduction
OpenStack is a powerful open-source cloud computing platform used by organizations to create and manage virtual machines (VMs) and networks. However, like any technology, OpenStack environments can be vulnerable to security threats, including compromised VMs that may be misused for hacking activities. In this article, we will explore how to identify a compromised tenant VM in an OpenStack environment and take action using network analysis tools like tcpdump and Wireshark.
(b) Detecting Compromised Tenant VMs
-
Anomalies in Network Traffic:
One of the first indicators of a compromised VM is unusual network traffic. VMs that have been compromised may engage in unauthorized or malicious activities, such as port scanning or DDoS attacks. Network analysis can help you detect these anomalies.
-
Logs and Alerts:
Set up logging and monitoring for your OpenStack environment. Log any suspicious activities and configure alerts for unusual network patterns or high network usage.
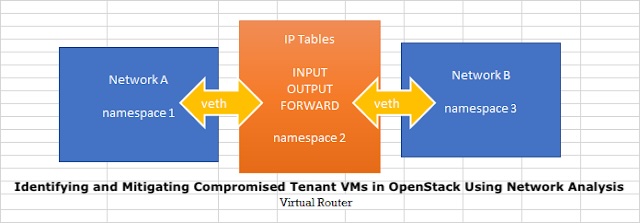
(c) Sniffing OpenStack Router Interfaces with tcpdump
-
Access to Neutron Routers:
To analyze network traffic in an OpenStack environment, you need access to the Neutron routers. Ensure that you have the necessary permissions or network administrator access.
-
Isolate Suspicious VM:
If you have a specific VM that you suspect is compromised, isolate it from the rest of the network to prevent further damage.
-
Capture Traffic:
Use
tcpdumpto capture traffic on the OpenStack router interfaces. This requires you to access the router namespace using theip netnscommand.
ip netns exec <namespace_name> tcpdump -i <interface_name> -w /path/to/output_file.pcap
<namespace_name>is the router’s namespace.<interface_name>is the router interface you want to monitor./path/to/output_file.pcapis the file to store the captured packets.
(c.1) Identify the router interfaces from the router namespace before running a tcpdump for analysis:
[root@pinakastra ~(hci)]# ip netns exec qrouter-058f0e71-3c5b-49fa-ba59-ae0d8b8a32dd ip addr
1: lo: <LOOPBACK,UP,LOWER_UP> mtu 65536 qdisc noqueue state UNKNOWN group default qlen 1000
link/loopback 00:00:00:00:00:00 brd 00:00:00:00:00:00
inet 127.0.0.1/8 scope host lo
valid_lft forever preferred_lft forever
inet6 ::1/128 scope host
valid_lft forever preferred_lft forever
25: qr-6a8a7e66-52: <BROADCAST,MULTICAST,UP,LOWER_UP> mtu 1450 qdisc noqueue state UNKNOWN group default qlen 1000
link/ether fa:16:3e:0a:09:2d brd ff:ff:ff:ff:ff:ff
inet 192.168.101.1/24 brd 192.168.101.255 scope global qr-6a8a7e66-52
valid_lft forever preferred_lft forever
inet6 fe80::f816:3eff:fe0a:92d/64 scope link
valid_lft forever preferred_lft forever
27: qr-a8ad467b-d5: <BROADCAST,MULTICAST,UP,LOWER_UP> mtu 1450 qdisc noqueue state UNKNOWN group default qlen 1000
link/ether fa:16:3e:fd:67:06 brd ff:ff:ff:ff:ff:ff
inet 10.0.1.1/24 brd 10.0.1.255 scope global qr-a8ad467b-d5
valid_lft forever preferred_lft forever
inet6 fe80::f816:3eff:fefd:6706/64 scope link
valid_lft forever preferred_lft forever
29: qg-72bcf6c4-f4: <BROADCAST,MULTICAST,UP,LOWER_UP> mtu 1500 qdisc noqueue state UNKNOWN group default qlen 1000
link/ether fa:16:3e:3f:a0:6a brd ff:ff:ff:ff:ff:ff
inet xx.xxx.xxx.xxx/28 brd 95.216.232.111 scope global qg-72bcf6c4-f4
valid_lft forever preferred_lft forever
inet xx.xxx.xxx.xxx/32 brd 95.216.232.109 scope global qg-72bcf6c4-f4
valid_lft forever preferred_lft forever
inet xx.xxx.xxx.xxx/32 brd 95.216.232.106 scope global qg-72bcf6c4-f4
valid_lft forever preferred_lft forever
inet xx.xxx.xxx.xxx/32 brd 95.216.232.104 scope global qg-72bcf6c4-f4
valid_lft forever preferred_lft forever
inet xx.xxx.xxx.xxx/32 brd 95.216.232.107 scope global qg-72bcf6c4-f4
valid_lft forever preferred_lft forever
inet6 fe80::f816:3eff:fe3f:a06a/64 scope link
valid_lft forever preferred_lft forever
[root@pinakastra ~(hci)]#
(c.2) Run the tcpdump on the identified private networks(tenant network interfaces):
[root@pinakastra ~(hci)]#  ip netns exec qrouter-058f0e71-3c5b-49fa-ba59-ae0d8b8a32dd tcpdump -ni qr-6a8a7e66-52 -w /root/netscan_12102023_192.168.101_snw.pcap
tcpdump: listening on qr-6a8a7e66-52, link-type EN10MB (Ethernet), capture size 262144 bytes
^C11793 packets captured
11793 packets received by filter
0 packets dropped by kernel
[root@pinakastra ~(hci)]#  ip netns exec qrouter-058f0e71-3c5b-49fa-ba59-ae0d8b8a32dd tcpdump -ni qr-a8ad467b-d5 -w /root/netscan_12102023_10.0.1_snw.pcap
tcpdump: listening on qr-a8ad467b-d5, link-type EN10MB (Ethernet), capture size 262144 bytes
^C11414 packets captured
11414 packets received by filter
0 packets dropped by kernel
[root@pinakastra ~(hci)]#
(c.3) Once the tcpdump is executed on the identified tenant network interfaces, it is time to copy the tcpdump output file to the local machine:
ajithnarayanan@Marshal Downloads % scp [email protected]:/root/netscan_12102023_192.168.101_snw.pcap .
Authorized uses only. All activity may be monitored and reported.
[email protected]'s password:
/etc/profile.d/lang.sh: line 19: warning: setlocale: LC_CTYPE: cannot change locale (UTF-8): No such file or directory
netscan_12102023_192.168.101_snw.pcap 100% 6153KB 713.3KB/s 00:08
ajithnarayanan@Marshal Downloads % scp [email protected]:/root/netscan_12102023_10.0.1_snw.pcap .
Authorized uses only. All activity may be monitored and reported.
[email protected]'s password:
/etc/profile.d/lang.sh: line 19: warning: setlocale: LC_CTYPE: cannot change locale (UTF-8): No such file or directory
netscan_12102023_10.0.1_snw.pcap 100% 5160KB 1.1MB/s 00:04
ajithnarayanan@Marshal Downloads %
(d) Analyzing Captured Traffic with Wireshark
-
Load the Capture File:
Open the capture file in Wireshark. You can do this by going to “File” > “Open” and selecting the
.pcapfile you captured earlier. -
Apply Filters:
Apply filters to narrow down your analysis. Look for SYN packets, which are commonly used in scanning activities.
tcp.flags.syn == 1
-
Identify Anomalies:
Look for repetitive patterns, a high frequency of SYN packets, or packets sent to multiple IP addresses and ports. These are potential signs of a scanning activity.
-
Identify the Source:
Determine the source IP address from which the scanning activity originates. This is the IP address of the compromised VM.
Taking Action
Once you’ve identified the compromised VM, it’s crucial to take immediate action:
- Isolation:
Isolate the compromised VM to prevent it from causing further harm to the network.
-
Forensics:
Perform a detailed analysis of the compromised VM to understand the extent of the compromise, remove malware, and patch vulnerabilities.
-
Incident Response:
Notify your organization’s incident response team to mitigate the incident and gather evidence for potential legal actions.
-
Prevention:
Review and strengthen your OpenStack security measures to prevent future compromises. Regularly update and patch your VMs and network configurations.
(e) Conclusion
Identifying and mitigating compromised tenant VMs in an OpenStack environment is a critical aspect of maintaining the security and integrity of your cloud infrastructure. Using network analysis tools like tcpdump and Wireshark, you can detect anomalies, identify the source of scanning activities, and take swift action to safeguard your network. Regular monitoring and proactive security measures are key to maintaining a secure OpenStack environment.
ABOUT PINAKASTRA
![]()
Pinakastra is an organization committed to making cloud computing infrastructure more accessible to enterprises, academia & research organizations by helping them in IT infrastructure consolidation through the Pinakastra™ cloud platform.
HAPPY LEARNING!
.article-body li > p { margin-left: 0; margin-right: 0; } .article-body li { margin-left: 10%; }
- OpenStack Neutron – Networking In Cloud Demystified - January 5, 2024
- Identifying and Mitigating Compromised Tenant VMs in OpenStack Using Network Analysis - October 25, 2023
- Complex Openstack Inventory – A Nightmare! - October 2, 2023