Cloud computing is expanding to new industries, according to the most recent OpenStack User Survey. These new areas for expansion include government/defense, film/media and telecommunications, which all increased compared to last year. Driving the latter is the growing cumulation of interest in Network Functions Virtualization (NFV). Coverage is also broadening geographically: while North America remains the area with the most deployments, Australia, New Zealand, Canada and Japan have all seen growth.
Those are some one of the key takeaways from the fifth consecutive survey conducted by the OpenStack User Committee. The User Committee sounds out people working with OpenStack ahead of each Summit, which occur every six months. The results in the most recent report are from voluntary surveys answered online between March 9, 2015 – April 16, 2015. This opt-in survey is not an exhaustive catalog of OpenStack deployments, but provides valuable intelligence on usage patterns and technology decisions in real-world deployments.
This post is the first in a three-part series analyzing the most recent OpenStack user survey. First up, a focus on user demographics and business drivers. Parts two and three will highlight deployment details and app developer insights, so stay tuned.
Survey Demographics
Since the initial user survey launched in 2013, there have been more than 1,576 responses with more than 751 unique deployments recorded. This report analyzes the most recent data to capture the most representative sample for a current snapshot of technology choices, trends and feedback. The results in this report are from a total of 634 responses and 270 unique deployments over the last survey cycle. 230 application development-related users also filled out that section. Questions are not mandatory, so the number of respondents per question varies.
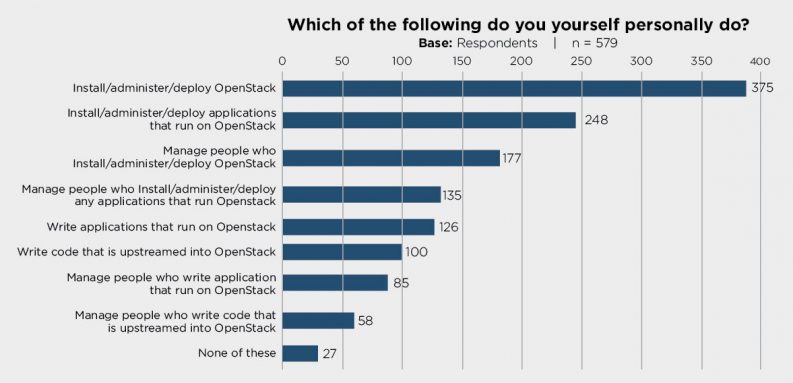
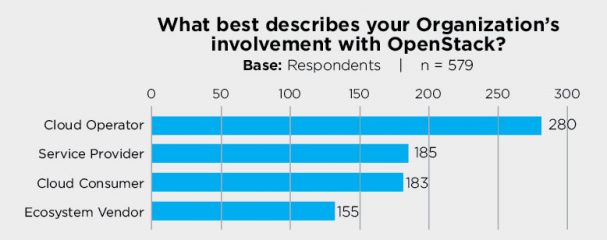
Respondents are predominantly OpenStack users who are currently deploying OpenStack, as shown by the top results when they were asked about their own activities. Survey results show how these users are actually configuring their clouds and applications for their organization, rather than those who are still evaluating or testing.
Industry and geography
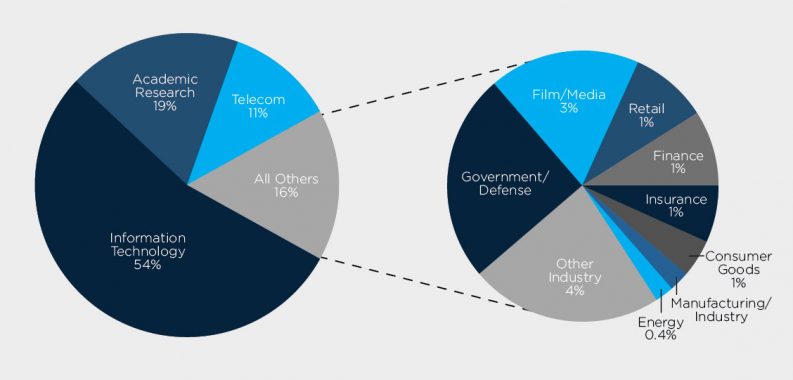
As more organizations step up to share their experience about their OpenStack adoption, industry representation continues to shift and evolve. In this survey, the non-IT industry users increased by 10 percent over the last survey, indicating that OpenStack is gaining traction in non-IT organizations. Government/defense and film/media both are up by 2 percent, and telecommunications increased by another percent over last year – a trend likely to continue with the increased interest in Network Functions Virtualization (NFV).
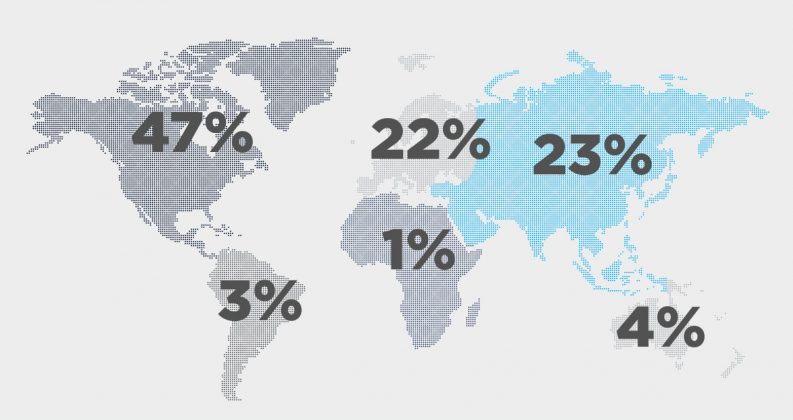
Global growth remains steady compared to last survey. Hot-spot areas are Canada, up 5 percent, Australia and New Zealand, up 3 percent each, and Japan, up 1 percent. North America remains the largest source, accounting for almost half of deployments. The map below illustrates survey respondent demographics, not growth over time.
Business Drivers
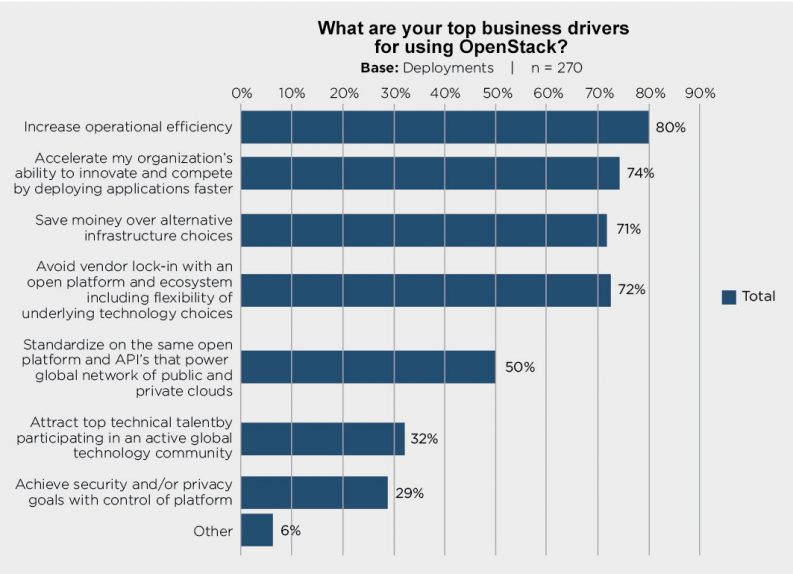
The survey results show that lower cost is still a major factor contributing to OpenStack use with “operational efficiency” and “save money” ranking first and third as top business drivers. However, the recent trend of transforming the IT functions of organizations to become more agile and innovative and disrupting the traditional purchased software model are also well represented at second and fourth places respectively.
Net Promoter Score
Another new question in this round of the survey was the Net Promoter Score (NPS®) question, “How likely are you to recommend OpenStack to a friend or colleague? (rank 0-10, 10 most likely.)” The NPS® score is calculated from the percentage of customers who are Promoters subtracted by the percentage who are Detractors producing a number between -100 and +100.
Promoters (score 9-10) are loyal enthusiasts who will keep buying and refer others, fueling growth.
Passives (score 7-8) are satisfied but unenthusiastic customers who are vulnerable to competitive offerings. Detractors (score 0-6) are unhappy customers who can damage your brand and impede growth through negative word-of-mouth.
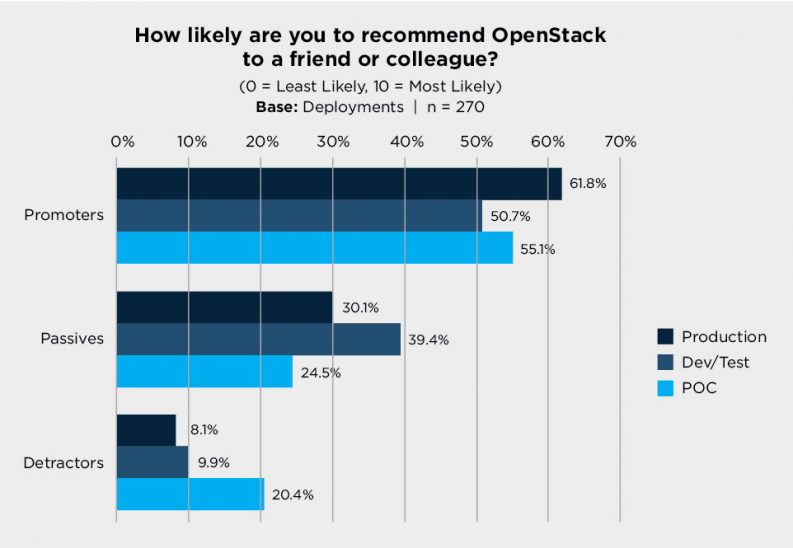
Here are the current NPS scores:
Production = 53.7 percent NPS
Dev / Test = 40.8 percent NPS
POC = 34.7 percent NPS
The evolution of these scores will be tracked in future surveys.
Behind the Survey
In preparation for the OpenStack Summit Vancouver, OpenStack operators and application developers were asked for feedback on their experiences in the OpenStack User Survey. This is the fifth consecutive survey conducted by the User Committee prior to each Summit starting in April 2013 and the previous survey in Paris, November 2014.
The goals of the survey are to generate insights based on a representative sample of OpenStack users, in order to better understand their organizational profiles, use cases and technology choices across different deployment stages and sizes. These insights are intended to provide feedback to the broader community, and to arm technical leaders and contributors with better data to make decisions.
Methodology
Over the last two years, managing the User Survey and analyzing results had become a large task for the User Committee even with support of Foundation Staff. For this and the previous round, it has been conducted with an external, independent research firm, Moor Insights & Strategy, to help analyze and report the data. The survey format this time is the result of a deep dive of their work, using the experience in the last survey. This should provide the foundation to achieve greater insights moving forward.
Specific updates and methodology as applied to the latest report:
In this version of the survey, we decided to look at any surveys that were created or updated between March 9, 2015 – April 16, 2015. This provides us with a smaller, but more representative sample current state of OpenStack deployments.
Every survey we make many small changes to the survey, based on developments in OpenStack and after analysis of the results (the full list can be found at the end of this report). For example, questions with lists of drivers are updated, a few questions are added based on new trends and requests from the development teams for further input on hot issues or new features, and some areas are clarified based on analysis about whether they are being understood.
One big change this time is the introduction of additional logic to ensure that only questions that are relevant to the user will be displayed. For example, if the deployment is using Swift, we will ask four additional questions about Swift – whereas others will not be shown those questions. This is important to ensure the survey is kept as short as possible, and generally improves the quality of results by limiting the respondee size to just those who have a valid answer.
The OpenStack User Committee is led by Subbu Allamaraju, Tim Bell and Jon Proulx. This core group provides oversight and guidance to a number of working groups that target specific areas for improvement.
- Must-see Containers Sessions at the Open Infrastructure Summit Shanghai - September 16, 2019
- OpenStack application developers share insights - May 16, 2015
- OpenStack users share how their deployments stack up - May 15, 2015

)


