I was considering making this a part of the "Monitoring UrbanCode Deployments with Docker, Graphite, Grafana, collectd and Chef!" series but as I didn’t include this in the original architecture so it would be more to consider this an addendum. In reality, it’s probably more of a fork as I’ll may continue with future blog postings about the architecture herein.
One of the issues I ran into right away while deploying the monitoring solution described in the above post was an internal topology managed by UrbanCode Deploy whereby each of the agent host machines had quirks and issues that required me to constantly tweak the monitoring install process. (Fixing yum and apt-get repositories, removing conflicts, installing unexpectedly missing libraries, conflicting JDKs.)
The reason for this? Each machine was installed by different people who installed the operating systems and the UrbanCode Deploy Agent in different ways with different options. It would have been great if all nodes were consistent and it would have made my life much easier.
It was at this point that my colleague Michael told me that I should create a blueprint in UrbanCode Deploy for the topology I want to deploy the monitoring solution into for testing.
Here’s Michael doing a quick demo of UrbanCode Deploy Blueprint Designer, also known as UrbanCode Deploy with Patterns in the video below:
http://www.youtube.com/watch?v=fFuRg6l3N44
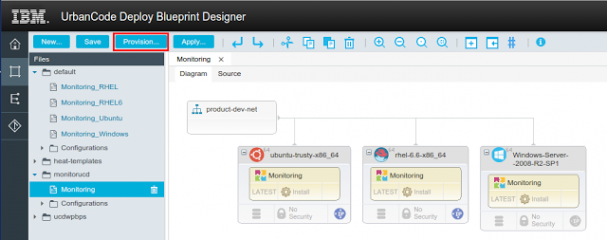
Fantastic, now I can create a blueprint of the desired topology, add a monitoring component to the nodes that I wish to have monitored and presto! Here is what the blueprint looks like in UrbanCode Deploy Blueprint Designer:
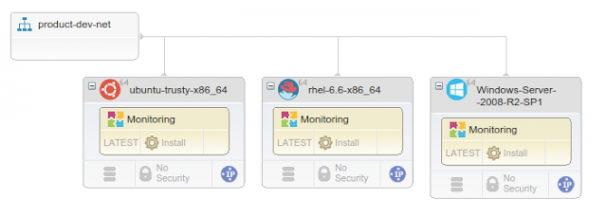
I created three nodes with three different operating systems just to show off that this solution works on different operating systems. (It also works on RHEL 7 but I thought adding another node would be overdoing it a little as well as cramming my already overcrowded RSA sketches).
This blueprint is actually a Heat Orchestration Template (HOT). You can see the source code here: https://hub.jazz.net/git/kuschel/monitorucd/contents/master/Monitoring/Monitoring.yaml
So, if we modify the original Installation in Monitoring UrbanCode Deployments with Docker, Graphite, Grafana, collectd and Chef! Part 1, it would look something like this:
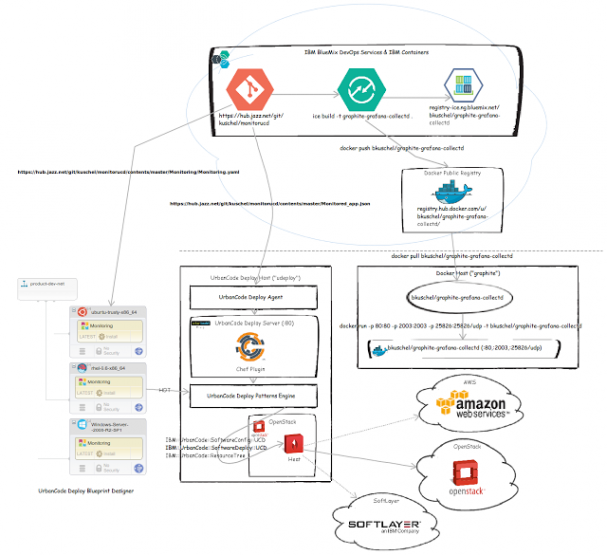
We don’t have any UrbanCode Deploy agents installed as the agent install is incorporated as part of the blueprint. You can see this in the yaml under the resources identified by ucd_agent_install_linux and ucd_agent_install_win. You’ll see some bash or powershell scripting that installs the UrbanCode Agent as part of the virtual machine initialization.
You’ll also see the IBM::UrbanCode::SoftwareDeploy::UCD, IBM::UrbanCode::SoftwareConfig::UCD and IBM::UrbanCode::ResourceTree resource types which allow the Heat engine to deploy create resources in UrbanCode Deploy and ensure that component processes are executed are installed into the virtual machines, once the UrbanCode Deploy agents are installed and started.
Ok, let’s take a time out and talk a little about how this all works. First, what’s Heat?
Heat is an orchestration engine that is able to call cloud provider APIs (and other necessary APIs) to actualize the resources that are specified in yaml into a cloud environment. Heat is part of the OpenStack project so it natively supports OpenStack Clouds but can also work with Amazon Web Services, IBM SoftLayer or any other cloud provider that is compliant with the OpenStack interfaces required to create virtual machines, virtual networks, etc.
In addition, Heat can be extended with other resource types like those for UrbanCode Deploy components that allows them to be deployed into environments provisioned by OpenStack via Heat using the Heat Orchestration Template (HOT) specified during a provisioning.
The UrbanCode Deploy Blueprint Designer provides a kick ass visual editor and a simple way to drag drop UrbanCode Deploy Components into Heat Orchestration Templates (HOT). It also provides the ability to connect to a cloud provider (OpenStack, AWS and IBM SoftLayer are currently supported) and deploy the HOT. You can monitor the deployment progress.
Oh, it also uses Git as a source for the HOTs (yaml) so that makes it super easy to version and share blueprints.
Ok, let’s go over the steps on how to install it. I assume you have UrbanCode Deploy installed and configured with UrbanCode Deploy Blueprint Designer and connected to an OpenStack cloud. You can set up a quick cloud using DevStack.
You’ll also need to install the Chef plugin from here: https://developer.ibm.com/urbancode/plugin/chef. Import the application from IBM BlueMix DevOps Service Git found here: https://hub.jazz.net/git/kuschel/monitorucd/contents/master/Monitored_app.json Import it from the "applications" tab:
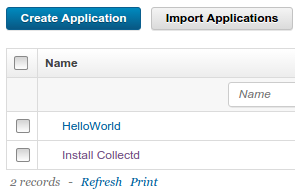
Use the default options in the import dialog. After, you should now see it listed in applications as "monitored." There will also be a new component in the "components" tab called monitoring:

I have made the Git repository public so the component is already configured to to to the IBM BlueMix DevOps Service Git and pull the recipe periodically and create a new version, you may change this behaviour in Basic Settings by unchecking the Import Versions Automatically setting.
You’ll have to fix up the imported process a little as I had to remove the encrypted fields to allow easier import.
Go to components->monitoring->processes-Install and edit the install collectd step:

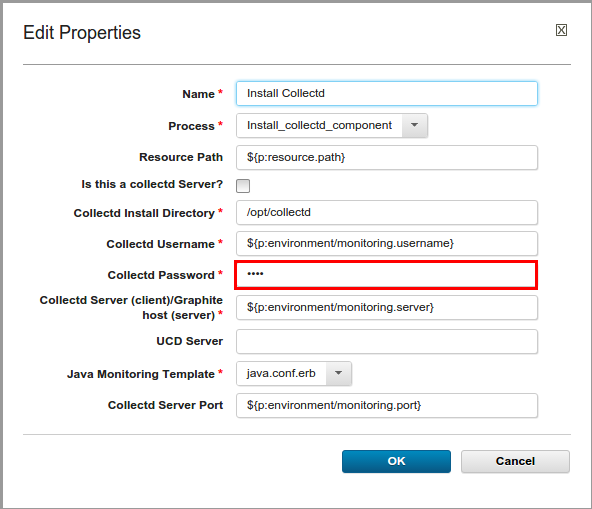
In the collectd password field put. You will see bullets, that’s OK. Copy/paste (and no spaces!):
${p:environment/monitoring.password}We need a metrics collector to store the metrics and a graphing engine to visualize them. We’ll be using a Docker image of Graphite/Grafana/Collectd I put together. You will need to ability to build run a docker container either using boot2docker or the native support available in Linux
I have put the image up on the public docker registry as bkuschel/graphite-grafana-collectd but you can also build it from the Dockerfile in IBM BlueMix DebOps Services’s Git at https://hub.jazz.net/git/kuschel/monitorucd/contents/master/DockerWithCollectd/Dockerfile
To get the image run:
docker pull bkuschel/graphite-grafana-collectNow run the image and bind the ports 80, 2003 and udp port 2 from the docker container to the hosts ports.
docker run -p 80:80 -p 2003:2003 -p 25826:25826/udp -t bkuschel/graphite-grafana-collectdYou can also mount file volumes to the container that contains the collector’s database, if you wish that to be persisted. Each time you restart the container, it contains a fresh database. This has its advantages for testing. You can also specify other configurations beyond what are provided as defaults. Look at the Dockerfile for the volumes.
You’ll need to connect the UrbanCode Blueprint Designer to Git by adding https://hub.jazz.net/git/kuschel/monitorucd to the repositories
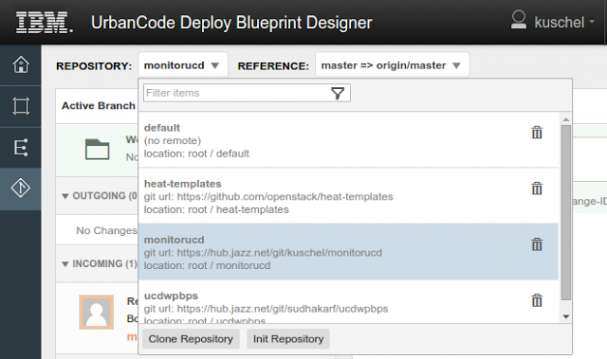
You should now see monitoring in the list of blueprints on the UrbanCode Deploy Blueprint Designer Home Page. Click on it to open the blueprint.
I am not going to cover the UrbanCode Component Processes as they are essentially the same the ones I described in Monitoring UrbanCode Deployments with Docker, Graphite, Grafana, collectd and Chef! (Part 2: The UCD Process) and Interlude #2: UCD Monitoring with Windows Performance Monitor and JMXTrans. The processes have been reworked to be executable using the application/component processes rather then solely from Resource Processes (generic). I also added some steps that do fix of typical problems in OpenStack images, such as fixing the repository and a workaround for a host name issue causing JMX not to bind properly.
The blueprint is also rudimentary and it may need to be tweaked to conform to the specific cloud set up in your environment. I created three virtual machines for Operating System images I happened to have available on my OpenStack, hooked them together on the private network and gave them external IPs so that I can access them. They all have the monitoring component added to them and should be deployed into the Monitored Application.
Once you’ve fixed everything up, make sure you select a cloud and then click "provision:"
It will now ask for launch configuration parameters, again, many of these will be specific to you environment but you should be able to leave everything as is.
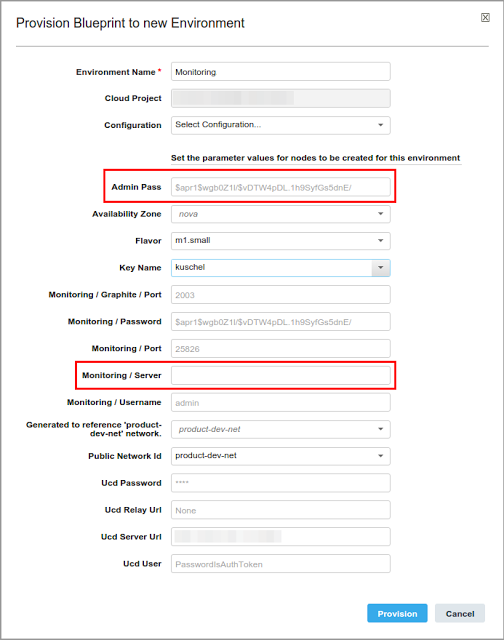
If you bound the Docker container to other different ports you’ll have to change the port numbers for graphite (2003) and Docker (25826).
You will need to set the admin password to something recognizable, it’s the Windows administrator password. You may or may not need this depending on how your Windows image is set up. (I needed it.)
The monitoring/server is the Public IP address of your Docker host running the bkuschel/graphite-grafana-collectd image. The monitoring/password is the one the is built into the Docker image. You will need to modify the Docker image to either not hard code this value or build a new image with a different password.
Once "provision" is clicked, something like this should happen:
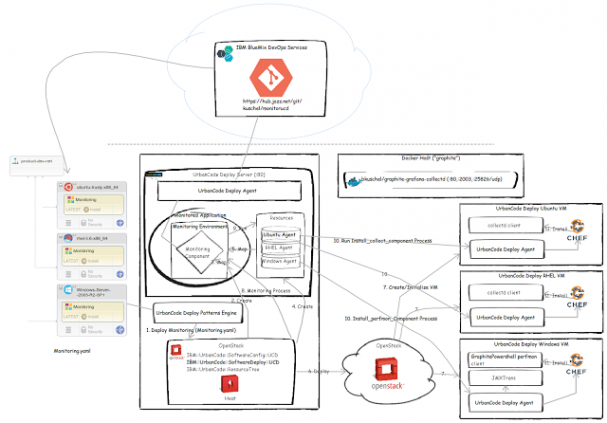
The monitoring.yaml(originating from Git) in UrbanCode Deploy Blueprint is passed to the heat engine on provisioning, with all parameters bound.
The heat engine creates an UrbanCode Deploy Environment in the application specified in yaml (this can be changed)
The UrbanCode Deploy Environment is mapped to the UrbanCode Deploy Component as specified in the yaml resource
It also creates UrbanCode Deploy resources that will be used to represent the UrbanCode Deploy agents once they come online
The agent resources are mapped to the environment.
Heat interacts with the cloud provider (OpenStack in this case) to deploy the virtual machines specified in the yaml.
The virtual machines are created and the agents installed as part of virtual machine intialization ("user data.")
Once the agents come online the component process is run
The component process will be run for each resource mapped to the environment
The component process runs the generic process Install_collectd_process (or Install_perfmon_process for Windows) on each agent.
The agent installs collectd or GraphitePowershellFunctions via Chef and performs other process steps as required to get the monitoring solution deployed.
The progress can be monitored in UrbanCode Deploy Blueprint Designer:
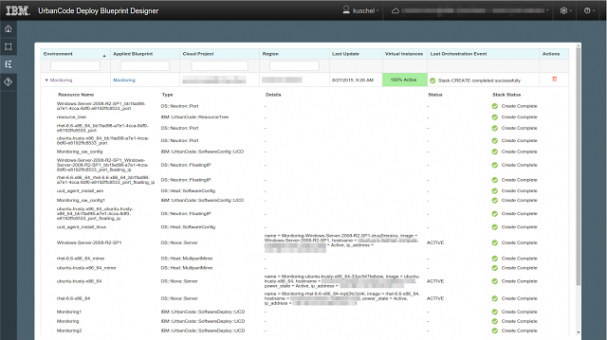
(Click here for larger version.)
Once the process is finished, the new topology should look something like this:
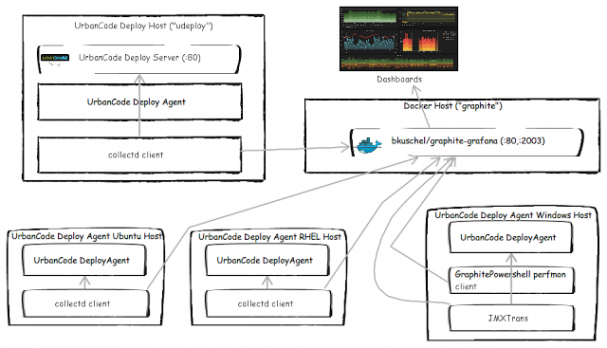
(For larger version, click here.)
That should be it, give it a shot. Once you’ve got it working, the results are quite impressive. Here are some Grafana performance dashboards for CPU and Heap based on the environment I deployed using this method. The three MonitoringMonitoring
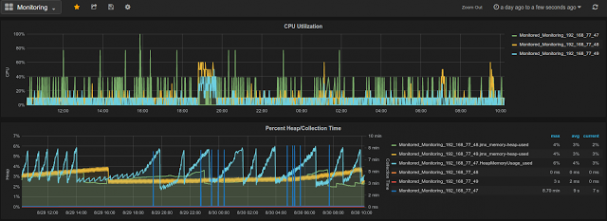
(For larger version, click here.)
This post first appeared on Boris Kuschel’s blog. You can also follow him on Twitter at @Boris_Kuschel. Superuser is always interested in how-tos and other contributions, please get in touch: [email protected]
Cover Photo by Oona Räisänen // CC BY NC

)


