Monasca provides monitoring as-a-service for OpenStack. It’s scalable, fault tolerant, supports multi-tenancy with Keystone integration and you can push metrics into it at any sampling frequency you like. You can bolt it on to your existing OpenStack distribution and it will happily go about collecting logs and metrics, not just for your control plane, but for tenant workloads too.
So how do you get started? Errr… well, one of the drawbacks of Monasca’s micro-service architecture is the complexity of deploying and managing the services within it. Sound familiar? On the other hand this micro-service architecture is one of Monasca’s strengths. The deployment is flexible and you can horizontally scale out components as your ingest rate increases. But how do you do all of this?
At StackHPC our answer is to use the OpenStack Kolla project which already provides some of the supporting infrastructure. To this effect we’ve been working with the Kolla community to add support for deploying Monasca over the past couple of cycles.
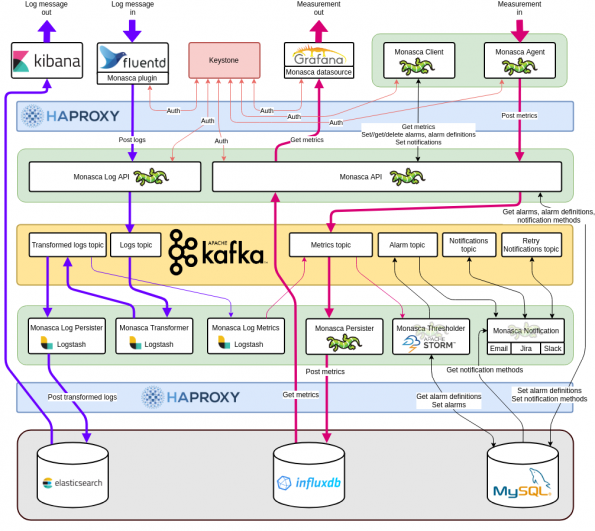
Here’s a diagram of what it currently looks like:
The important thing to note: almost everything in the diagram can be deployed in a highly available configuration. What’s even better is that this is all managed by Kolla-Ansible out-of-the-box. If you want a three node Monasca deployment then simply add your three monitoring nodes to the Kolla-Ansible inventory, and follow the Kolla documentation to deploy them. Of course, it’s worth mentioning that currently this will use the same database and load balancing services as other components in Kolla-Ansible. If this is a concern, or you’re not using Kolla-Ansible to manage your OpenStack deployment, then you can deploy Monasca standalone and integrate, if you wish, with an external instance of Keystone that needn’t be provided by Kolla.
So how can the community get involved? The first answer is by trying it out! By following the Kolla vagrant documentation in conjunction with the Kolla documentation for Monasca it’s remarkably easy to stand up. Once it’s running you’re likely to start thinking of things to monitor. Examples include anything from RabbitMQ cluster queue length to database writes. Adding support in Kolla-Ansible for gathering these metrics out of the box would be a great thing to contribute.
Secondly, we mentioned earlier that nearly all services can be deployed in a highly available configuration. So which ones can’t? The Monasca fork of Grafana is one of them and InfluxDB, which requires an enterprise license for clustering is the other. Or course, the latter could be solved by buying a license, but Monasca supports Cassandra as a backend and adding support for that to Kolla could make a nice improvement.
Finally, we come to the Monasca Grafana fork which has been a longstanding fly in the ointment for the Monasca project. The fork arose to realize the vision of being able to log into Grafana with your OpenStack credentials and look through a single-pane of-glass at the performance of your OpenStack project. This is a vision that we believe is worthwhile, but unfortunately efforts to merge Keystone integration into Grafana have so far failed and the fork has fallen behind. A renewed effort at integrating Grafana with Monasca is required and if you’d like to get involved with that you’ll be welcomed with open arms.
About the author
Doug Szumski is a cloud software engineer at StackHPC. This is a follow-up to a post he wrote about Monasca coming to Kolla.
- Exploring the Open Infrastructure Blueprint: Huawei Dual Engine - September 25, 2024
- Open Infrastructure Blueprint: Atmosphere Deep Dive - September 18, 2024
- Datacomm’s Success Story: Launching A New Data Center Seamlessly With FishOS - September 12, 2024

)


