)
Before micro-services became popular, it was easier to figure out what was slowing down your system. With just a few components to track, you could identify application behavior by looking at single components in isolation, but with the transition to micro-services individual end user requests often go through dozens of system components as the number of machines and services grow logs provide less and less visibility.
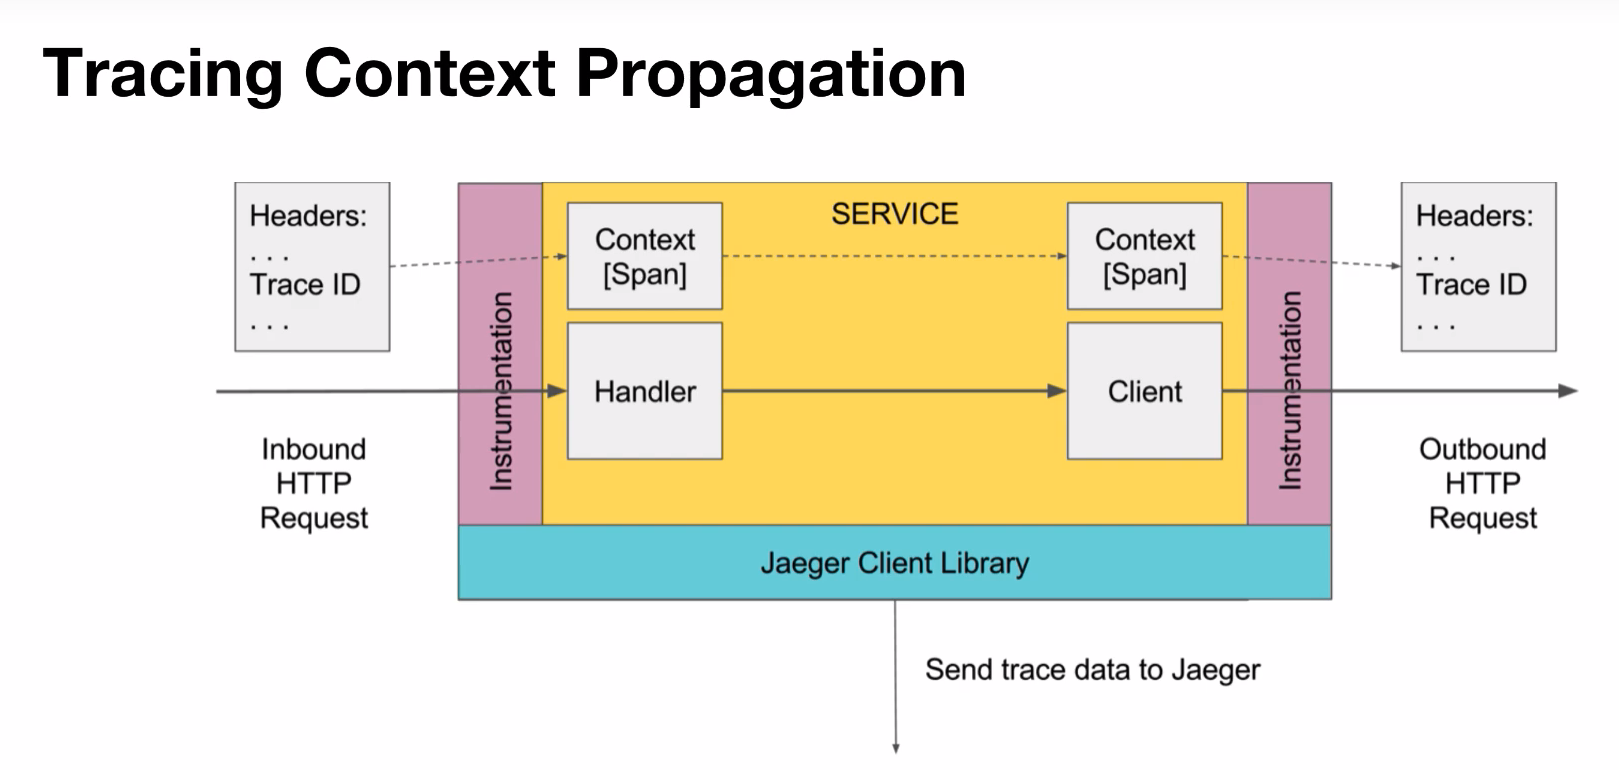
That’s where tracing comes in. It helps diagnose problems by capturing information about individual requests in the system by capturing activity records or traces at the various instrumentation points placed in the distributed system components. Each trace contains information such as instrumentation point name, a timestamp and other contextual information. These traces can then be stitched together to form a request flow graph that shows the control flow within the system. These tools can be used to characterize the normal behavior of the system and detect changes in behavior during periods of poor performance — rooting out the causes of decrease performance.
The solution
Boston University students Oindrilla Chatterjee, Bowen Song, Golsana Ghaemi, Aditya Singh working with mentors from Red Hat and the Massachusetts Open Cloud (MOC) devised a solution using Jaeger, an open source project offering end-to-end distributed tracing and Ceph, an open-source high performance distributed storage application maintained by Red Hat.
 The main steps:
1. Create instances on OpenStack and deploy Ceph.
2. Study the architecture of Blkin and Jaeger.
3. Deploy HotROD application on local machines and visualized the traces.
4. Compile Ceph with Blkin on virtual cluster comprising of three OSDs, one monitor node and one RadOS Gateway.
5. Deploy a simple distributed chat application on MOC in order to visualize the traces from a distributed system.
6. Compare the tracing mechanisms of Blkin with Jaeger in the context of tracepoints, metadata propagation and backend.
7. Find equivalence between Blkin and Jaeger functions.
8. Replace the Blkin functions with the corresponding Jaeger functions.
Of the lessons learned, the group says that debugging large distributed systems like Ceph with traces that are not “always on” traces can be tedious and Jaeger is an effective solution to the problem, though they urged the Ceph and Jaeger communities to provide more detailed documentation for installation and deployment.
Check out the whole 14-minute video below.
- Demystifying Confidential Containers with a Live Kata Containers Demo - July 13, 2023
- OpenInfra Summit Vancouver Recap: 50 things You Need to Know - June 16, 2023
- Congratulations to the 2023 Superuser Awards Winner: Bloomberg - June 13, 2023