)
Let’s say your OpenStack cloud is up and running, but your sense of how well it runs is a bit nebulous.
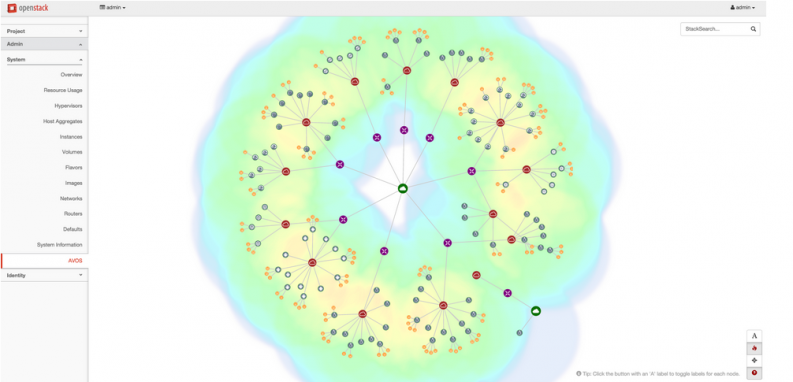
Enter AVOS (Analytics & Visualization on OpenStack.) Developed by a team at Cisco to give operators a clearer picture of their clouds, it was shown at the monitoring session at the Mid-Cycle Ops Meetup, along with VMTP.
Cisco’s Debo Dutta, who worked on it with lead developer and "co-conspirator" Alex Holden, talked to Superuser over email about this recently-released tool.
What were the operational issues that led to the creation of the dashboard?
We were running Hadoop workloads on OpenStack and optimizing the stack for better performance. We realized, while operating our mini-cloud, that we had no idea of (or visibility into) what is happening when workloads are run. This made us think about visibility and interactive dashboards with minimal information to maximize the insight to the operator.
What kind of information were you looking to show?
We wanted a single page with a bunch of useful features that we felt would have helped us. For example, we needed to search for things within our project, hence we put a search feature. We needed to see metrics only when we drilled down. Hence we created the topology view and upon click, we drill down and show more metrics and info.
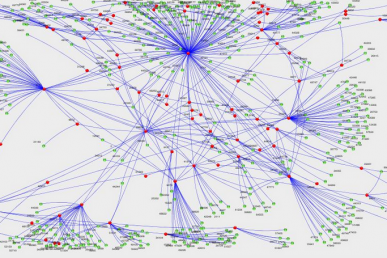
Then we wanted to figure out when something was going wrong. Instead of first writing complex data science algorithms (which we also do), we felt it would be better for the human expert to detect anomalies quickly if we presented the information to the person in a novel way. Hence we added heat maps. Finally, we felt the need to see virtual network VM-VM traffic and this lead to collecting data from Open vSwitch and showing the virtual network traffic matrix.
What problem does it solve?
AVOS solves the problem of presenting operational insights of an OpenStack cloud in a crisp fashion, interactively conveying a lot of data with a very intuitive user experience.
We believe that a combination of smart insights, data science and interactive visualization could lead to better tools for both the operator as well as the tenants. This is a gap in OpenStack today.
Where can people find it?
We released an early version at: https://github.com/CiscoSystems/avos
We also have interactive storage/Ceph insights which we demoed here: http://lnkd.in/bpp7kJ6
Cover Photo by Master Phillip // CC BY NC
- OpenStack Homebrew Club: Meet the sausage cloud - July 31, 2019
- Building a virtuous circle with open infrastructure: Inclusive, global, adaptable - July 30, 2019
- Using Istio’s Mixer for network request caching: What’s next - July 22, 2019